Eliminate Racial Disproportionality and Advance Racial Equity

  • Equity in Kindergarten Readiness

    Although the statewide rate of kindergarten readiness has improved somewhat over the past six years (as measured by the Washington Kindergarten Inventory of Developing Skills assessment), this change has not benefitted all racial/ethnic groups equally. The readiness rates for American Indian/Alaska Native, Hispanic/Latino, and Native Hawaiian/Other Pacific Islander children remain substantially below the rates for children from other groups. Readiness rates for Black/African American children increased briefly, but have recently fallen. Asian and White children continue to have the highest rates of kindergarten readiness and those rates have increased faster than have the rates for other groups. Equity in kindergarten readiness is an outcome indicator for our strategic priority to eliminate racial disproportionality and advance racial equity.

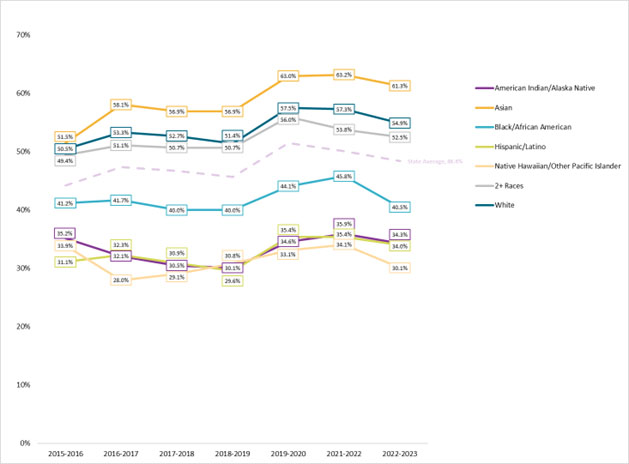
    Kindergarten Readiness by Race/Ethnicity, 2015-2022 School Years
      kinder readiness
     
  • Disproportionality in Child Welfare

    Child welfare disproportionality is another outcome indicator for our strategic priority to eliminate racial disproportionality and advance racial equity. DCYF tracks disproportionality in Child Welfare across multiple decision points, using Disproportionality Ratios. Scores of 0 – 0.99 indicate that, compared to its proportion in the population, a group is underrepresented at that decision point, while scores of 1.1 and greater indicate that a group is overrepresented. Black/African American, American Indian/Alaska Native, and White children and youth are overrepresented compared to their representation in the underlying population.
    Much of these disproportionalities in placement are attributable to disproportionalities at intake.

    Racial/Ethnic Disproportionality Ratios for All Child Welfare Intakes (Screened Out or Screened-In), 2014-2022
      graph
    Racial/Ethnic Disproportionality Ratios for Screened-In Child Welfare Intakes, 2014-2022
      graph
    Racial/Ethnic Disproportionality Ratios for Child Welfare Removals, 2014-2021
      graph
     
  • Room Confinement and Isolation

    Clients in JR can be placed in room confinement (locked in the room designated for their sleeping, during times when other clients are outside of their rooms) or in isolation (locked in a room that is not designated for their sleeping, often a padded room). DCYF tracks the 30 day rate of room confinement and isolation for clients released from residential facilities each state fiscal year (SFY). In SFY 2023, the 30 day RCI rate for Hispanic clients was 2.97, meaning that Hispanic clients who released in SFY 2023 experienced, on average, 2.97 RCI events every 30 days, during their stay with JR.

    Thirty Day Rate of Room Confinement/Isolation by Race/Ethnicity, SFY 2017-2023
      depressed adults
     
  • Community Facility Placement

    All clients in JR start at an institution. After they have spent 10% or 30 days of their sentence in an institution, most clients can be considered for placement in a community facility. DCYF tracks the disparity ratio of community facility placement. A ratio of 1.0 indicates that clients of that race/ethnicity are placed in community facilities at the same rate that they are placed in JR. A ratio above 1 indicates that group is placed at a higher frequency, and a ratio below 1 indicates that they are placed at a lower rate than their overall population in JR.

    Racial/Ethnic Disparity Ratios for Community Facility Placement, 2017-2023
      depressed adults
     
  • Discretionary Parole Placement

    Approximately 50% of clients in JR are assigned to parole aftercare. Although about half of parole assignments are mandatory based on a client’s committing offense, the remaining half of parole assignment is based on JR discretion. DCYF tracks racial/ethnic disparity in discretionary parole placement using a Disparity Ratio. A value of 1.0 indicates that clients of that race/ethnicity are placed on parole at the same rate that they are placed in JR. A ratio above 1 indicates that group is placed at a higher frequency, and a ratio below 1 indicates that they are placed at a lower rate than their overall population in JR.

    Racial/Ethnic Disparity Ratios for Discretionary Parole Placement, SFY 2017-2023
      depressed adults
     
  • Disparity in Child Welfare

    Where disproportionality identifies the over or under representation of a group compared to that group in the underlying population, disparity identifies inequity after a child or youth has entered the system by comparing the proportion of a group at a decision point to the proportion of that group at a prior decision point. DCYF tracks disparity in Child Welfare using Disparity Ratios; a disparity ratio of 1.0 would represent no change between decision points, whereas ratios greater than 1.0 indicate that the group proportion has increased since the prior decision point. An increase means that other racial/ethnic groups have exited the system to a greater extent by this point and is a sign of disparity.

    Racial/Ethnic Disparity Ratios for Out-of-Home Care Placements within 12 Months of Intake, 2014-2021
      graph
    Racial/Ethnic Disparity Ratios for Out-of-Home Care Lasting Longer than Two Years, 2014-2019
      graph
     
  • Disproportionality in Subsidy Enrollment

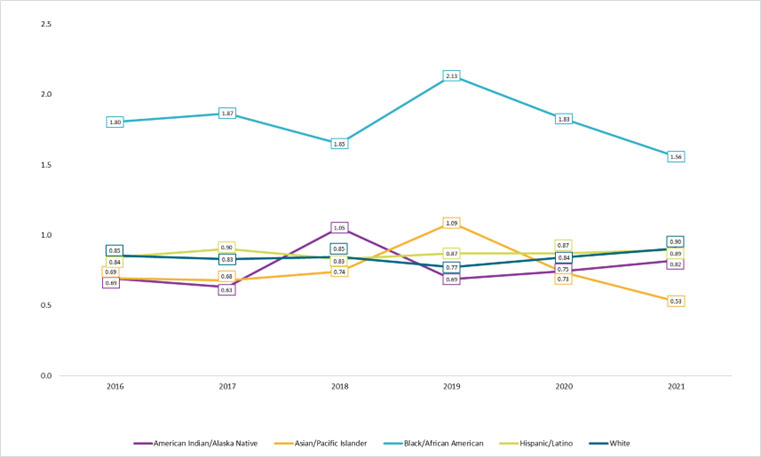
    From 2016 to 2021, subsidized child care programs have enrolled between 27 - 42 percent of the income-eligible population of children under 5 years of age in Washington State. Black/African American children have been consistently over-represented, while other groups have, in most years, been slightly under-represented to varying degrees.

    Racial/Ethnic Disproportionality Ratios for Child Care Subsidy Uptake, School Years 2016-2021
      graph
     
  • Disproportionality in ECEAP Enrollment

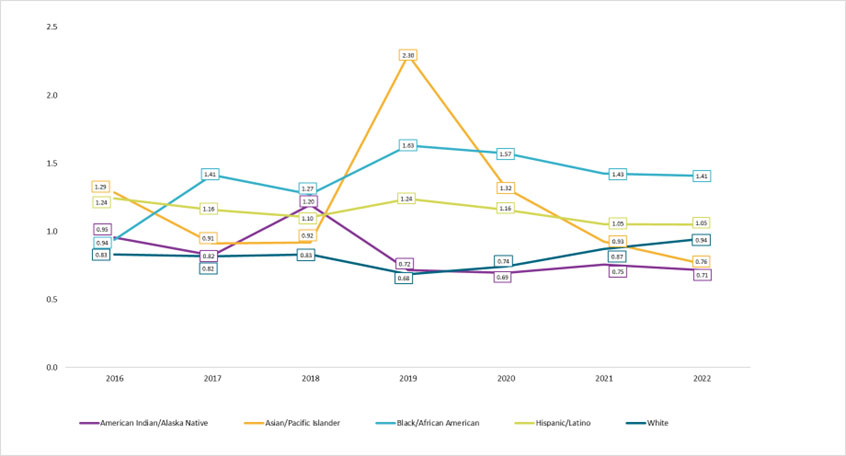
    Each year, around 15,000 children are enrolled in Washington's Early Childhood Education Assistance Program (ECEAP). DCYF tracks disproportionality in ECEAP enrollment using a Disproportionality Ratio. A disproportionality ratio of 1.0 would indicate that children of that race/ethnicity are enrolled in ECEAP at the same rate they exist in the underlying income-eligible population. For the past few years, Black/African American children have been slightly over-represented in ECEAP enrollment, while American Indian/Alaska Native children have been slightly under-represented.

    Racial/Ethnic Disproportionality Ratios for ECEAP Enrollment, School Years 2016-2022
      graph
     
  • Equity in Dialectical Behavior Therapy in JR

    Dialectical Behavior Therapy (DBT) is the primary residential treatment for youth and young adults in Washington’s Juvenile Rehabilitation (JR) facilities. Two integral components of DBT are individual counseling sessions and skills groups. JR’s standard is for residents to attend 4 of each per month. Equitable access to appropriate treatment is a driver of equitable outcomes. Residents who are Black/African American or Asian/Pacific Islander received less DBT treatment than did other groups.

    Average Number of Dialectical Behavior Therapy (DBT) Individual Sessions Attended per Month by Juvenile Rehabilitation Facilities Residents, by Race/Ethnicity, SFYs 2021-2023
      graph
    Average Number of Dialectical Behavior Therapy (DBT) Skills Groups Attended per Month by Juvenile Rehabilitation Facilities Residents, by Race/Ethnicity, SFYs 2021-2023
      graph