Racial Equity

  • Equity in Kindergarten Readiness

    Although the statewide rate of kindergarten readiness has improved somewhat over the past six years (as measured by the Washington Kindergarten Inventory of Developing Skills assessment), this change has not benefitted all racial/ethnic groups equally. The readiness rates for American Indian/Alaska Native, Hispanic/Latino, and Native Hawaiian/Other Pacific Islander children remain substantially below the rates for children from other groups. Readiness rates for all groups are now above their pre-COVID levels, but Asian and White children continue to have the highest rates of kindergarten readiness and those rates have increased faster than have the rates for other groups. Asian and White children continue to have the highest rates of kindergarten readiness and those rates have increased faster than have the rates for other groups. Equity in kindergarten readiness is an outcome indicator for our strategic priority to eliminate racial disproportionality and advance racial equity.

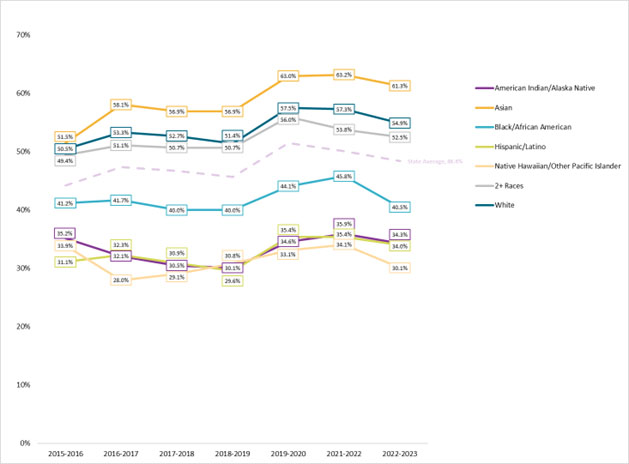
    Kindergarten Readiness by Race/Ethnicity, 2015-2023 School Years
      kinder readiness
     
  • Disproportionality and Disparity in Child Welfare

    Please visit DCYF's Office of Innovation, Alignment, and Accountability's (OIAA) Disproportionality and Disparity in Child Welfare dashboard

    This dashboard includes measures of disproportionality in all intakes (screened-in and screened out), in screened-in intakes, and in removals within 12 months of intake. Users can select whether disproportionality is measured in relation to the general population of Washington state or in relation to the population with incomes limited to 200% of the Federal Poverty Level or less. This dashboard additionally includes measures of disparity in out-of-home placement and in lengths of stay longer than two years.

     
  • Disproportionality in Subsidy Enrollment

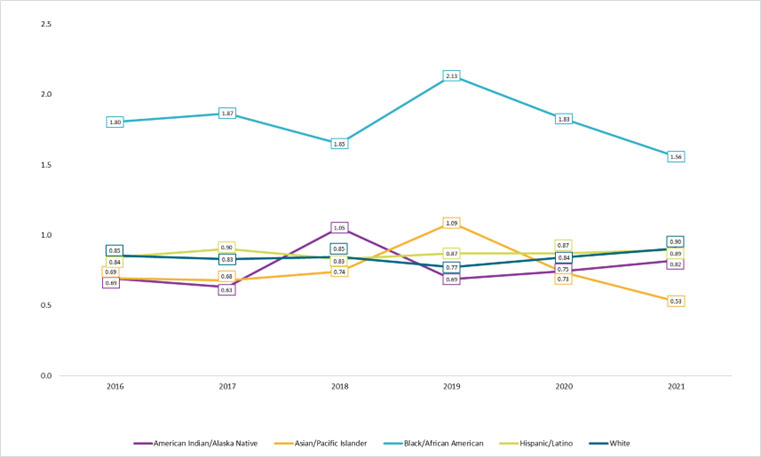
    From 2016 to 2021, subsidized child care programs have enrolled between 27 - 42 percent of the income-eligible population of children under 5 years of age in Washington State. Black/African American children have been consistently over-represented, while other groups have, in most years, been slightly under-represented to varying degrees.

    Racial/Ethnic Disproportionality Ratios for Child Care Subsidy Uptake, School Years 2016-2023
      graph
     
  • Disproportionality in ECEAP Enrollment

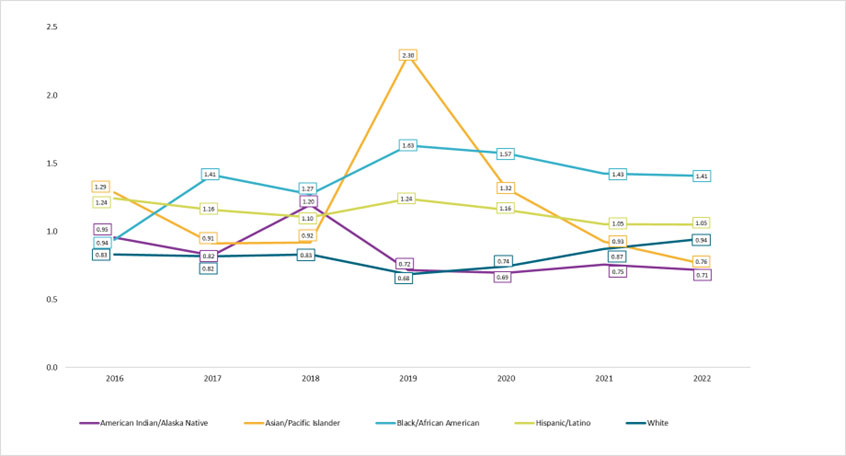
    Each year, around 15,000 children are enrolled in Washington's Early Childhood Education Assistance Program (ECEAP). DCYF tracks disproportionality in ECEAP enrollment using a Disproportionality Ratio. A disproportionality ratio of 1.0 would indicate that children of that race/ethnicity are enrolled in ECEAP at the same rate they exist in the underlying income-eligible population. For the past few years, Black/African American children have been slightly over-represented in ECEAP enrollment, while American Indian/Alaska Native children have been slightly under-represented.

    Racial/Ethnic Disproportionality Ratios for ECEAP Enrollment, School Years 2016-2023
      graph
     
  • Economic Stability

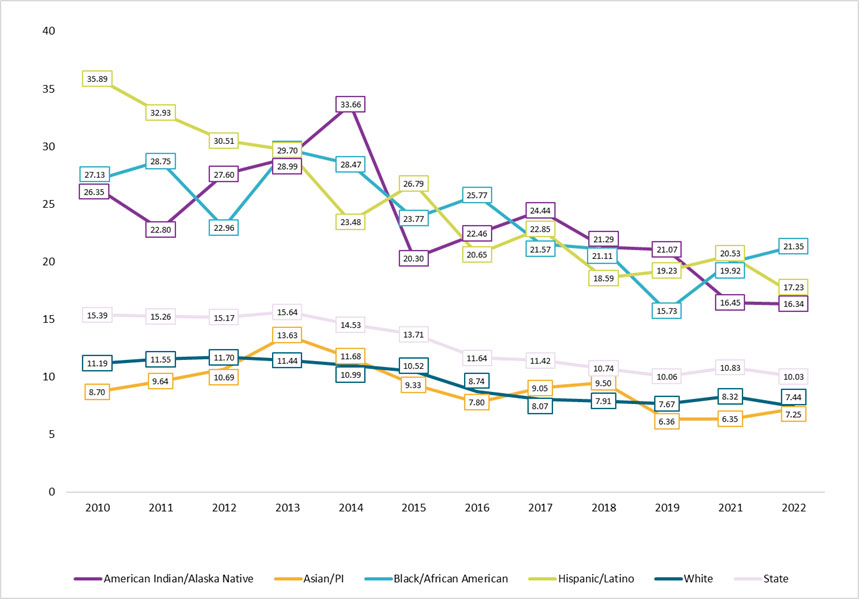
    Another goal of DCYF is that families have economic stability. As DCYF staff engaged stakeholders across the state on what they wanted to see children and families achieve, we heard repeatedly about the importance of basic needs being met. Without economic security, many other positive outcomes related to health and education become harder to achieve. Census data on Washington State families with children living below the poverty level show disparities based on race and ethnicity. While White and Asian families live below the poverty level at rates lower than the state average of 10%, others have much higher rates. American Indian/Alaska Native, Black/African American, and Hispanic/Latino families with children live below the poverty level at rates much higher than what White families experience.

    Percent of Washington State Families with Children, Living Below Poverty Level, by Race/Ethnicity, 2010-2023
      family engagement