Create High Quality, Integrated B-8 System

  • Foster Care Kindergarten Readiness

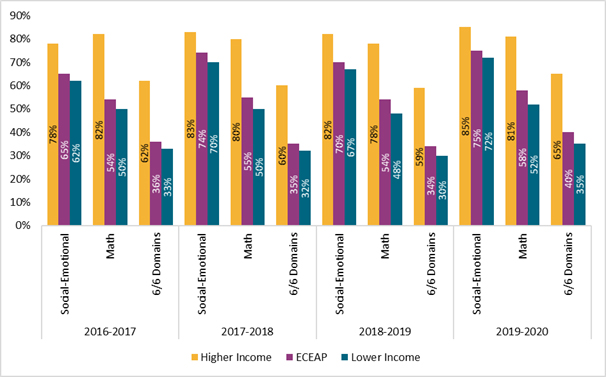
    Children who experience foster care are prepared for kindergarten at lower rates than children who do not experience foster care. Although the overall rate of kindergarten readiness has increased over the past few years, there has not been a substantial increase in kindergarten readiness for children who have experienced foster care.

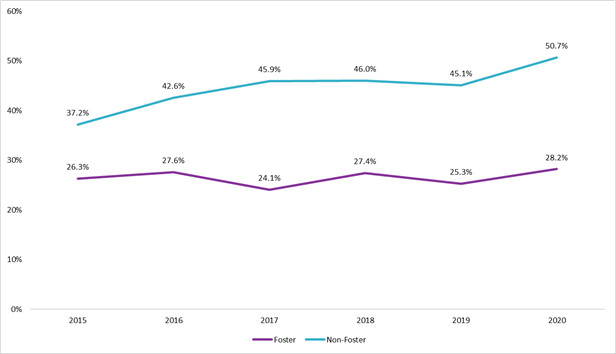
    Kindergarten Readiness by Foster Care Status, 2015-2024 School Years

      Line graph showing kindergarten readiness by foster care status, for the 2025-2024 school years. Students who have experienced foster care are consistently less ready for kindergarten than their peers who have not experienced foster care. For both groups, annual readiness rates vary, but for non-foster students, improvements made prior to 2020 have been maintained since 2020. In the 2015-2016 school year, 46.8% of non-foster students were ready for kindergarten, and in 2024-2025, 57.1% of them were ready. For foster students there is annual variation but not evidence of sustained improvement in kindergarten readiness. In 2015-2016, 33.1% of non-foster students were ready for kindergarten, and in 2024-2025 34.6% were ready.
     
  • ECEAP Kindergarten Readiness

    Kindergarten readiness is an outcome indicator for the DCYF priority to create a high-quality, integrated B-8 system. During the 2023-2024 school year, 88% of children who participated in the Early Childhood Education and Assistance Program (ECEAP) came from families that qualified for Free or Reduced Price Lunch (FRPL). Across the years, children who participate in ECEAP are prepared for kindergarten at higher rates than their FRPL-qualifying peers.

    ECEAP Kindergarten Readiness by Domain, Relative to Income, School Years 2018-2023

      Clustered column chart comparing the percent of kindergarten ready children who come from higher income families to those who come from lower income families and those who participated in ECEAP, by domain, for the school years 2018-2023. The domains presented are Social-Emotional, Math, and Ready in All 6 domains measured by the Washington Kindergarten Inventory of Developing Skills (WaKids). Across all years and for all domains, children from higher-income families are ready at higher rates than lower-income or ECEAP children, but children who participate in ECEAP, and who are mostly also from lower-income families, are ready for kindergarten at higher rates than their peers from lower-income families. In the 2023-2024 school year, 84% of children from higher-income families were ready for kindergarten in the social-emotional domain, compared to 74% of ECEAP participants and 72% of children from lower-income families. In the math domain, 84% of children from higher-income families were ready for kindergarten, compared to 64% of ECEAP participants and 61% of children from lower-income families. And in all six domains measured by WaKIDS, 68% of children from higher-income families were ready for kindergarten, compared to 45% of ECEAP participants and 42% of children from lower-income families
     
  • ECEAP Funded Slot Growth

    The Early Childhood Education and Assistance Program (ECEAP) provides child-centered, individualized preschool education and health coordination services on a foundation of strengths-based family support. The Fair Start for Kids Act (FSKA) requires that by July 2026, ECEAP services be available for all eligible children. As a result, ECEAP is expanding throughout Washington State, and DCYF is monitoring its growth as part of our priority to create a high-quality, integrated B-8 system.

    Funded ECEAP Slots, by Type, School Years 2015-2024

      Stacked area chart showing the number of funded ECEAP slots, by type, for the school years 2015-2024. The number of Working Day slots has steadily increased from 492 to 916 over those years. The number of School Day slots has also steadily increased, from 1,450 to 9,042, while the number of Part Day slots rose from 9,749 to a peak of 10,387 in 2018-2019 and 2020-2021 and has been steadily decreasing since the following year, to 6,247 slots in the 2024-2025 school year.
     
  • Working Connections Child Care

    Working Connections Child Care (WCCC) helps eligible families pay for child care. When a family qualifies for child care subsidy benefits and chooses an eligible provider, the state pays a portion of the cost of child care. DCYF works to ensure that all WCCC applications are processed in a timely manner and is monitoring the rates at which they are approved.

    Number and Percent of Working Connections Child Care (WCCC) Applications Processed and Approved, SFYs 2015-2025

      Combination column chart and line graph showing the number and percent of Working Connections Child Care (WCCC) applications received, processed, and approved for state fiscal years 2016 to 2025. Each year, only 1-5 applications remain unprocessed. The percent of approved applications decreased from 59% in 2016 to a low of 48% in 2021, and has been steadily increasing each year since. In 2025, 64% of WCCC applications were approved.
     
  • Early Achievers Rated Providers

    Early Achievers is an easy-to-understand quality rating system for participating early care providers. DCYF monitors Early Achievers ratings as a balancing indicator for our priority to create a high-quality, integrated B-8 system. 

    Number and Percent of Early Achievers Enrolled Providers by Rating, SFY 2019-2025

      Bar chart showing the number and percent of Early Achievers enrolled providers, by rating, state fiscal years 2019-2025. The total number of providers has steadily increased over the past five years. From 2020-2024 the number and percent of unrated providers steadily increased, but in 2025 it came down by 4 percentage points, from 61-57%. Across the years, the proportions of rated providers have changed only a little. Providers rated 2 decreased from 3% in 2019 to 1% in 2025. Providers rated 3 are the largest group, making up 30% of providers in 2019 and 31% in 2025. Providers rated 3+ decreased from 8% in 2019 to 5% in 2025. Providers rated 4 decreased from 7% in 2019 to 5% in 2025. And providers rated 5 increased from less than 0.5% in 2019 to 1% in 2025. In 2024 only 9 providers were rated 5, but in 2025 59 providers were rated 5. Most likely, the increase in providers rated 5 accounts for the decreases in providers rated 3+ and 4.