Strategic Priority Outcome

  • Equity in Kindergarten Readiness

    Although the statewide rate of kindergarten readiness has improved somewhat over the past six years (as measured by the Washington Kindergarten Inventory of Developing Skills assessment), this change has not benefitted all racial/ethnic groups equally. The readiness rates for American Indian/Alaska Native, Hispanic/Latino, and Native Hawaiian/Other Pacific Islander children remain substantially below the rates for children from other groups. Readiness rates for all groups are now above their pre-COVID levels, but Asian and White children continue to have the highest rates of kindergarten readiness and those rates have increased faster than have the rates for other groups. Asian and White children continue to have the highest rates of kindergarten readiness and those rates have increased faster than have the rates for other groups. Equity in kindergarten readiness is an outcome indicator for our strategic priority to eliminate racial disproportionality and advance racial equity.

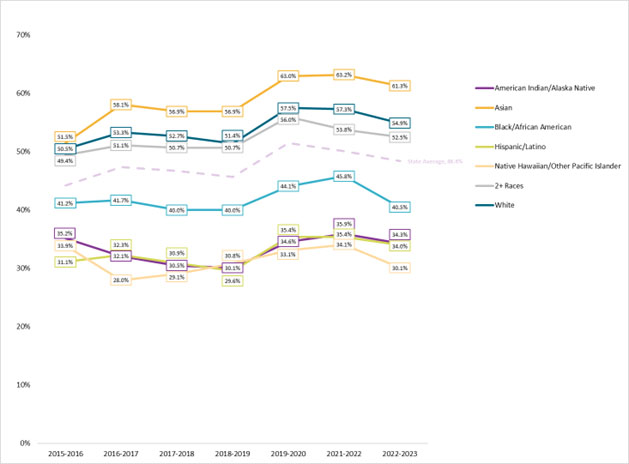
    Kindergarten Readiness by Race/Ethnicity, 2015-2023 School Years
      kinder readiness
     
  • Disproportionality and Disparity in Child Welfare

    Please visit DCYF's Office of Innovation, Alignment, and Accountability's (OIAA) Disproportionality and Disparity in Child Welfare dashboard

    This dashboard includes measures of disproportionality in all intakes (screened-in and screened out), in screened-in intakes, and in removals within 12 months of intake. Users can select whether disproportionality is measured in relation to the general population of Washington state or in relation to the population with incomes limited to 200% of the Federal Poverty Level or less. This dashboard additionally includes measures of disparity in out-of-home placement and in lengths of stay longer than two years.

     
  • Foster Care Kindergarten Readiness

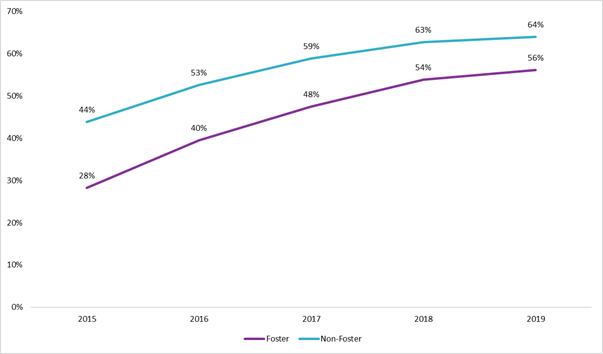
    Children who experience foster care are prepared for kindergarten at lower rates than children who do not experience foster care. Although the overall rate of kindergarten readiness has increased over the past few years, there has not been a substantial increase in kindergarten readiness for children who have experienced foster care.

    Kindergarten Readiness by Foster Care Status, 2015-2020 School Years
      graph
     
  • ECEAP Kindergarten Readiness

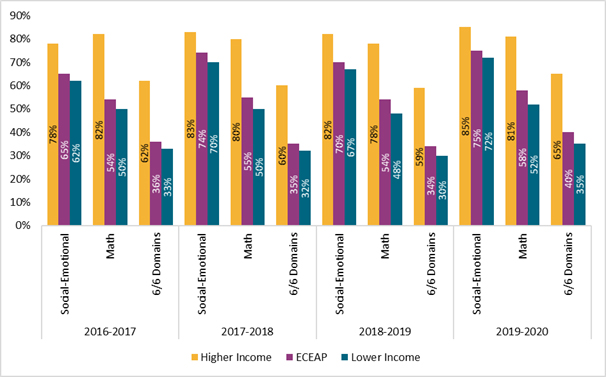
    Kindergarten readiness is an outcome indicator for the DCYF priority to create a high-quality, integrated B-8 system. During the 2019-2020 school year, 95% of children who participated in the Early Childhood Education and Assistance Program (ECEAP) came from families that qualified for Free or Reduced Price Lunch (FRPL). Across the years, children who participate in ECEAP are prepared for kindergarten at higher rates than their FRPL-qualifying peers.

    ECEAP Kindergarten Readiness by Domain, Relative to Income, School Years 2016-2019
      graph
     
  • Employment After Foster Care

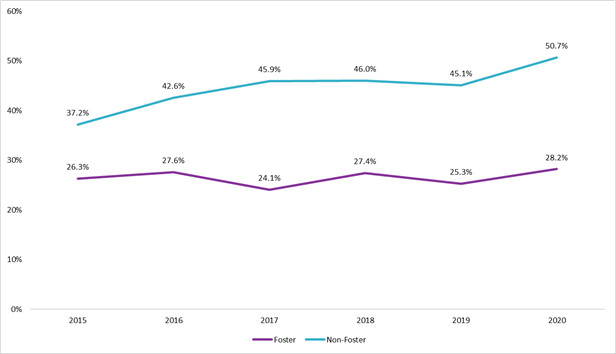
    Between 2015 and 2019, the gap between employment rates for young adults who have experienced foster care and those who have not, decreased in Washington State. During the same time period however, the gap in median earnings between the two groups widened, and that increase cannot be attributed to differences in number of hours worked. Longitudinal analysis shows that over time, the employment rate for young adults who have experienced foster care approaches the employment rate for young adults who have not, but that the gap in median earnings continues to increase.

    Employment Among Young Adults, Age 18+, by Former Foster Status, 2015-2019
      graph
     
  • High School Graduation of Youth in Foster Care

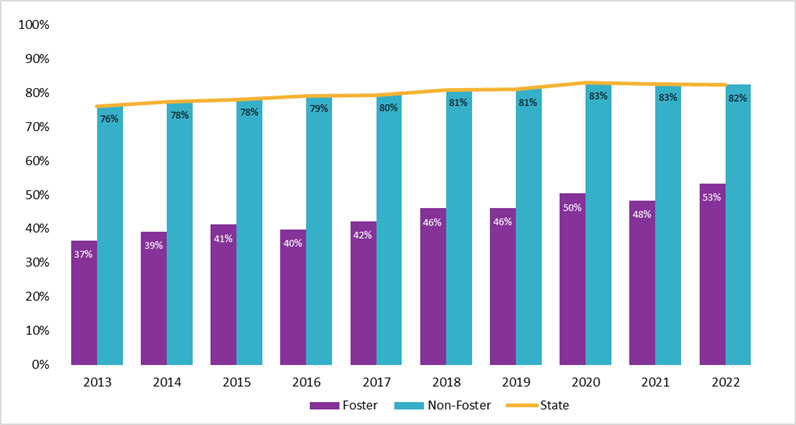
    One of DCYF’s strategic priorities is that we create successful transitions to adulthood for youth and young adults in our care. Graduation from high school is an outcome indicator for this priority. Statewide, the 2023 four year graduating cohort included 85,306 students, 84% of whom graduated on time. In most years, an additional 2-3 percent of the class have graduated by the end of their fifth year. Among that 2023 cohort, 552 youth were indicated as having been in foster care. Youth who have not been in foster care graduated at the rate of the overall class, whereas 53% of youth who had been in foster care graduated on time.

    Four Year Graduation Rate, by Foster Care Status, Classes of 2013-2023
      graph
     
  • Foster Care and Mental Health

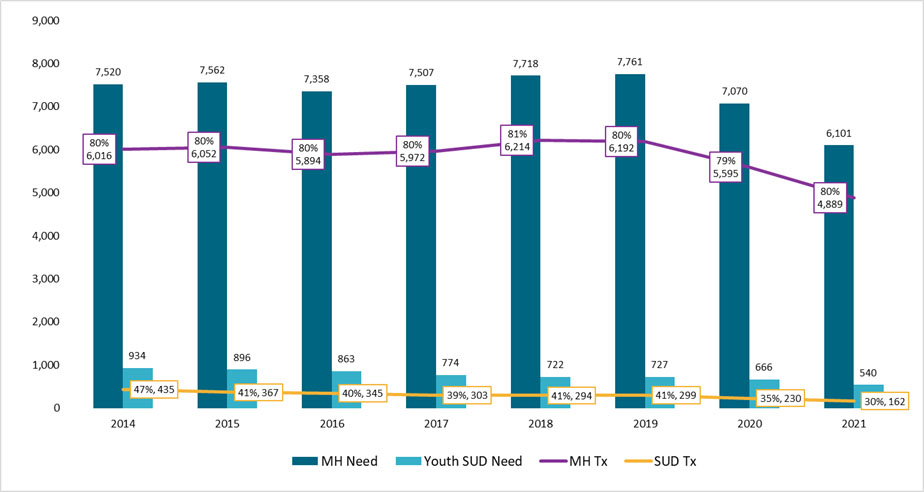
    A DCYF strategic priority is to improve the quality and availability of provider services. As an outcome indicator, we are monitoring the needs and provided treatment of children and youth in foster care. Research shows that exposure to traumatic events and chronic stress — such as poverty, housing instability, family conflict, abuse and neglect, and exposure to caregivers’ mental illness or substance use disorder — contribute to the greater behavioral health needs of children and youth experiencing out-of-home care.

    Needs and Treatment of Children and Youth in Foster Care, SFY 2014-2021
      graph