Early Learning

  • Equity in Kindergarten Readiness

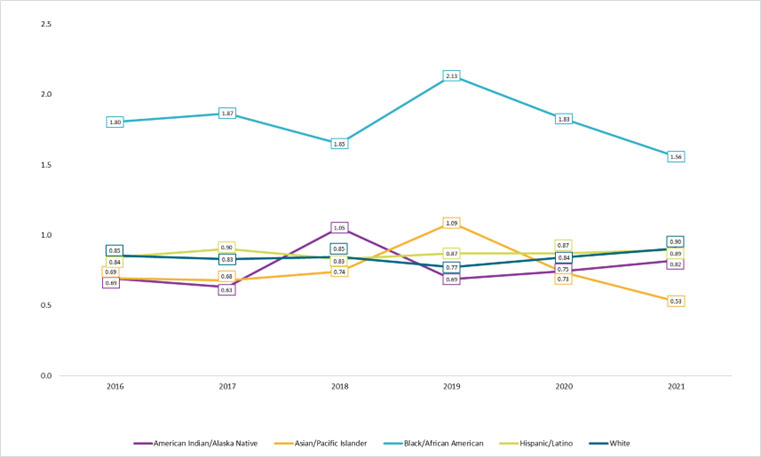
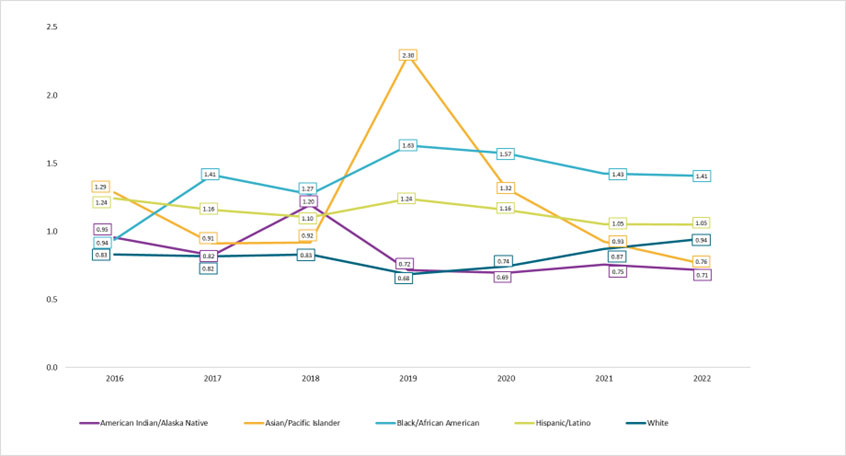
    Although the statewide rate of kindergarten readiness has improved somewhat over the past six years (as measured by the Washington Kindergarten Inventory of Developing Skills assessment), this change has not benefitted all racial/ethnic groups equally. The readiness rates for American Indian/Alaska Native, Hispanic/Latino, and Native Hawaiian/Other Pacific Islander children remain substantially below the rates for children from other groups. Readiness rates for all groups have returned to their pre-COVID levels, but Asian and White children continue to have the highest rates of kindergarten readiness and those rates have increased faster than have the rates for other groups. Equity in kindergarten readiness is an outcome indicator for our strategic priority to eliminate racial disproportionality and advance racial equity.

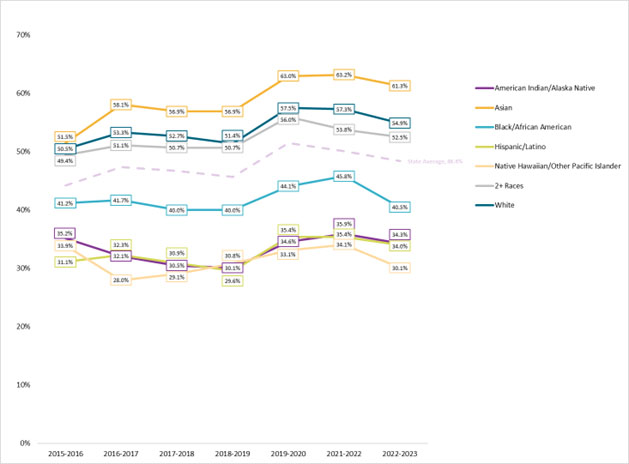
    Kindergarten Readiness by Race/Ethnicity, 2015-2024 School Years

      Line graph showing kindergarten readiness by race/ethnicity for the 2015-2024 school years. While the specific percentages have risen somewhat for all groups during that time period, the pattern of readiness among groups is consistent. Asian children are most ready, followed by White children, with children of 2 or more races very close behind. Then there’s a significant gap in readiness, and Black children are the group in the middle of the distribution. There is another gap, albeit a smaller one, between the readiness of Black children and the three groups that follow. American Indian/Alaska Native children, Hispanic/Latino children, and Native Hawaiian/Pacific Islander children are less ready than other groups. In 2024, 65% of Asian children, 60% of White children, 60% of children of 2 or more races, 48% of Black children, 41% of American Indian/Alaska Native children, 40% of Hispanic/Latino children, and 37% of Native Hawaiian/Pacific Islander children were fully ready for kindergarten.
     
  • Foster Care Kindergarten Readiness

    Children who experience foster care are prepared for kindergarten at lower rates than children who do not experience foster care. Although the overall rate of kindergarten readiness has increased over the past few years, there has not been a substantial increase in kindergarten readiness for children who have experienced foster care.

    Kindergarten Readiness by Foster Care Status, 2015-2024 School Years

      Line graph showing kindergarten readiness by foster care status, for the 2025-2024 school years. Students who have experienced foster care are consistently less ready for kindergarten than their peers who have not experienced foster care. For both groups, annual readiness rates vary, but for non-foster students, improvements made prior to 2020 have been maintained since 2020. In the 2015-2016 school year, 46.8% of non-foster students were ready for kindergarten, and in 2024-2025, 57.1% of them were ready. For foster students there is annual variation but not evidence of sustained improvement in kindergarten readiness. In 2015-2016, 33.1% of non-foster students were ready for kindergarten, and in 2024-2025 34.6% were ready.
     
  • ECEAP Kindergarten Readiness

    Kindergarten readiness is an outcome indicator for the DCYF priority to create a high-quality, integrated B-8 system. During the 2023-2024 school year, 88% of children who participated in the Early Childhood Education and Assistance Program (ECEAP) came from families that qualified for Free or Reduced Price Lunch (FRPL). Across the years, children who participate in ECEAP are prepared for kindergarten at higher rates than their FRPL-qualifying peers.

    ECEAP Kindergarten Readiness by Domain, Relative to Income, School Years 2018-2023

      Clustered column chart comparing the percent of kindergarten ready children who come from higher income families to those who come from lower income families and those who participated in ECEAP, by domain, for the school years 2018-2023. The domains presented are Social-Emotional, Math, and Ready in All 6 domains measured by the Washington Kindergarten Inventory of Developing Skills (WaKids). Across all years and for all domains, children from higher-income families are ready at higher rates than lower-income or ECEAP children, but children who participate in ECEAP, and who are mostly also from lower-income families, are ready for kindergarten at higher rates than their peers from lower-income families. In the 2023-2024 school year, 84% of children from higher-income families were ready for kindergarten in the social-emotional domain, compared to 74% of ECEAP participants and 72% of children from lower-income families. In the math domain, 84% of children from higher-income families were ready for kindergarten, compared to 64% of ECEAP participants and 61% of children from lower-income families. And in all six domains measured by WaKIDS, 68% of children from higher-income families were ready for kindergarten, compared to 45% of ECEAP participants and 42% of children from lower-income families
     
  • ECEAP Funded Slot Growth

    The Early Childhood Education and Assistance Program (ECEAP) provides child-centered, individualized preschool education and health coordination services on a foundation of strengths-based family support. The Fair Start for Kids Act (FSKA) requires that by July 2026, ECEAP services be available for all eligible children. As a result, ECEAP is expanding throughout Washington State, and DCYF is monitoring its growth as part of our priority to create a high-quality, integrated B-8 system.

    Funded ECEAP Slots, by Type, School Years 2015-2024

      Stacked area chart showing the number of funded ECEAP slots, by type, for the school years 2015-2024. The number of Working Day slots has steadily increased from 492 to 916 over those years. The number of School Day slots has also steadily increased, from 1,450 to 9,042, while the number of Part Day slots rose from 9,749 to a peak of 10,387 in 2018-2019 and 2020-2021 and has been steadily decreasing since the following year, to 6,247 slots in the 2024-2025 school year.
     
  • Working Connections Child Care

    Working Connections Child Care (WCCC) helps eligible families pay for child care. When a family qualifies for child care subsidy benefits and chooses an eligible provider, the state pays a portion of the cost of child care. DCYF works to ensure that all WCCC applications are processed in a timely manner and is monitoring the rates at which they are approved.

    Number and Percent of Working Connections Child Care (WCCC) Applications Processed and Approved, SFYs 2015-2025

      Combination column chart and line graph showing the number and percent of Working Connections Child Care (WCCC) applications received, processed, and approved for state fiscal years 2016 to 2025. Each year, only 1-5 applications remain unprocessed. The percent of approved applications decreased from 59% in 2016 to a low of 48% in 2021, and has been steadily increasing each year since. In 2025, 64% of WCCC applications were approved.
     
  • Early Achievers Rated Providers

    Early Achievers is an easy-to-understand quality rating system for participating early care providers. DCYF monitors Early Achievers ratings as a balancing indicator for our priority to create a high-quality, integrated B-8 system. 

    Number and Percent of Early Achievers Enrolled Providers by Rating, SFY 2019-2025

      Bar chart showing the number and percent of Early Achievers enrolled providers, by rating, state fiscal years 2019-2025. The total number of providers has steadily increased over the past five years. From 2020-2024 the number and percent of unrated providers steadily increased, but in 2025 it came down by 4 percentage points, from 61-57%. Across the years, the proportions of rated providers have changed only a little. Providers rated 2 decreased from 3% in 2019 to 1% in 2025. Providers rated 3 are the largest group, making up 30% of providers in 2019 and 31% in 2025. Providers rated 3+ decreased from 8% in 2019 to 5% in 2025. Providers rated 4 decreased from 7% in 2019 to 5% in 2025. And providers rated 5 increased from less than 0.5% in 2019 to 1% in 2025. In 2024 only 9 providers were rated 5, but in 2025 59 providers were rated 5. Most likely, the increase in providers rated 5 accounts for the decreases in providers rated 3+ and 4.
     
  • Disproportionality in Subsidy Enrollment

    From 2016 to 2024, subsidized child care programs have enrolled between 27 - 42 percent of the income-eligible population of children under 5 years of age in Washington State. Black/African American children have been consistently over-represented, while other groups have, in most years, been slightly under-represented to varying degrees.

    Racial/Ethnic Disproportionality Ratios for Child Care Subsidy Uptake, School Years 2016-2024

      Line graph showing racial/ethnic disproportionality ratios for child care subsidy uptake, school years 2016-2024. The patterns of representation are fairly consistent over the years. In 2016,  Black/African American children were over-represented in subsidy participation, at 1.85 times their presence in the eligible population, and in 2024 they participated at 1.64 times their presence in the population. Both Hispanic/Latino and White children receive subsidy at nearly the same rate that they’re present in the eligible population. In 2016, Hispanic/Latino children participated at 0.84, and White children at 0.85 times their presence in the population. In 2024, Hispanic/Latino children participated at 0.98 and White children at 0.93 times their presence in the population. American Indian/Alaska Native children are slightly under-represented in subsidy participation. In 2016, American Indian/Alaska Native children participated at 0.71 times their representation in the population, while Asian/Pacific Islander children participated at 0.72 times their representation in the population. In 2024, American Indian/Alaska Native children participated at 0.7 times their representation in the population, while Asian/Pacific Islander children participated at 0.64 times their representation in the population.
     
  • Disproportionality in ECEAP Enrollment

    Each year, around 15,000 children are enrolled in Washington's Early Childhood Education Assistance Program (ECEAP). DCYF tracks disproportionality in ECEAP enrollment using a Disproportionality Ratio. A disproportionality ratio of 1.0 would indicate that children of that race/ethnicity are enrolled in ECEAP at the same rate they exist in the underlying income-eligible population. For the past few years, Black/African American children have been slightly over-represented in ECEAP enrollment, while American Indian/Alaska Native and Asian/Pacific Islander children have been slightly under-represented.

    Racial/Ethnic Disproportionality Ratios for ECEAP Enrollment, School Years 2016-2024

      Line graph showing racial/ethnic disproportionality ratios for ECEAP enrollment, school years 2016-2024. The patterns of representation are fairly consistent over the years. After 2016, when Black/African American children were represented in ECEAP participation at 0.94 times their presence in the eligible population, they have been somewhat over-represented in ECEAP participation. By 2024 they participated in ECEAP at 2.01 times their presence in the eligible population. The representation of other groups has varied a bit each year, but in most years is fairly close to proportionate. In 2016, Hispanic/Latino children participated at 1.24 times their presence in the population, and in 2024 they participated at 0.89 times their population presence. In 2016, White children participated in ECEAP at 0.83 times their presence in the population, and in 2024 they participated at 1.11 times their population presence. In 2016, American Indian/Alaska Native children participated in ECEAP at 0.95 times their representation in the population, and in 2024 they participated at 0.64 times their population presence. In 2016, Asian/Pacific Islander children participated at 1.29 times their representation in the population, and in 2024 Asian/Pacific Islander children participated at 0.71 times their representation in the population.
     
  • Kindergarten Readiness

    One of DCYF’s child outcome goals is that children should be ready for kindergarten. Each year over 75,000 children enter kindergarten in Washington’s public school system. Across all income groups, 55% of children in Washington are ready for kindergarten (as measured by the Washington Kindergarten Inventory of Developing Skills assessment). Children from higher income families are most likely to be ready for kindergarten, while children from middle income and lower income families are ready for kindergarten at lower rates.

    Kindergarten Readiness, by Household Income Group (Relative to Federal Poverty Level), 2023-2024 School Year

      Mosaic chart showing kindergarten readiness by household income group, relative to the federal poverty level, for the 2023-2024 school year. Among all children, 55% were ready for kindergarten in 6/6 WAKids domains, but a greater proportion of children from higher income families were ready for kindergarten, while a smaller proportion of children from lower income families were ready for kindergarten. Among the 55,000 children from families greater than 185% of the federal poverty limit (FPL), 69% were ready for kindergarten in 6/6 domains of the WAKids assessment. Among the 1,000 children from families making between 110% and 185% of the FPL, 52% were ready for kindergarten in all 6 of the WAKids domains. And among the 11,000 children from families making under 110% of the FPL, 45% were ready for kindergarten in all 6 WAKids domains