
DCYF’s Office of Innovation, Alignment, and Accountability (OIAA) launched this data dashboard in support of Strengthen Families Locally (SFL). SFL is a multi-year community-based prevention project in Washington communities.
This dashboard provides summary data to local communities. Insights and trends of families involved in the state’s child welfare system can inform prevention planning efforts.
Key Information Included
The dashboard tracks important details about the child welfare system, such as:
Demographic Characteristics:
- Age
- Race/Ethnicity
Geographic variation:
- Rates of CPS Screen-Ins
- Counts and rates of out-of-home care
Statewide placement rates
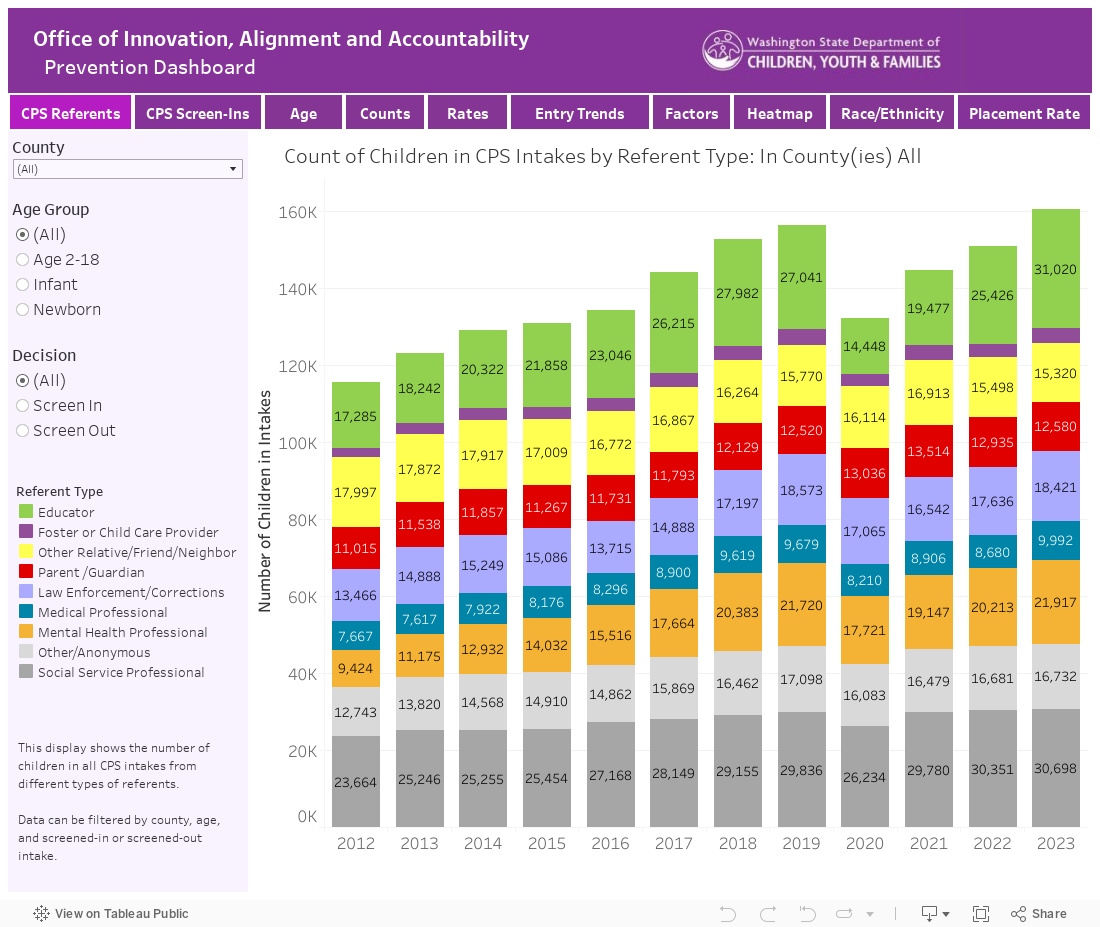
Types of Referents
Factors that contribute to Out of Home Care
This dashboard is updated annually.
Additional data resources that may be of interest to help inform child maltreatment prevention efforts:
- RDA Community Risk and Protection Profiles for Substance Abuse Prevention
- Child Welfare Overview, FY 2022
- Out-of-Home Care Entry &Exit Trends, 2018-2021
- DCYF Family First Services Needs Assessment, 2022
- Child Welfare-Early Learning Navigators – Evaluative Brief, 2022
- RDA – Substance Use Disorder Treatment Penetration among Child Welfare-Involved Caregivers
Footnotes
"Indicated parental substance use” includes two subgroups of children often seen in other DCYF/OIAA analyses: 1) Substance exposed/affected infants, and 2) Children entering care with parental substance use as a contributor to the lack of child safety. While most of the infants in the first category who enter care their first year of life are also in the second category (88% in 2022), the overlap is not complete, so we’ve combined the two groups here for a more complete count. In 2022, more than 780 children entered out-of-home care with “indicated parental substance use."
Masking – Due to data confidentiality, cell sizes <10 are masked/redacted/not visible.
De-duplication – in all views, children are de-duplicated within years, so that the data represent unique children, rather than cases, intakes, or placements within each year.
Race/Ethnicity – OIAA makes use of WSRDAC/M reporting standard for reporting race/ethnicity (Washington State Racial Disproportionality Advisory Committee/Modified). This means we have disaggregated and recombined the multi-racial category, so that multiracial American Indian/Alaska Native (AI/AN) and multiracial Black/African American children will appear in the larger AI/AN and Black categories. For reference on why and how we use this method, see OIAA’s report: Using Data in DCYF to Advance Racial Equity, 2021.
Data Source: DCYF Entries into Care and Intake data, from OIAA FamLink Data Warehouse, 2010-2022.
Data Files
- Children in CPS Intakes by Referent Type, 2010-2022 (dashboard panel 01)
- Children in Screened-In CPS Intakes, 2010-2022 (dashboard panel 02)
- Age Distribution for Children Entering Out-of-Home Care, 2010-2022 (dashboard panel 03)
- Annual Trends of Entries into Out-of-Home Care, 2010-2022 (dashboard panels 04-06)
- Race/ethnicity Percentage of Children Entering Out-of-Home Care, 2010-2022 (dashboard panel 07)
- Rate of Children Entering Out-of-Home Care by Race/ethnicity, 2010-2022 (dashboard panel 08)
Acknowledgement
This dashboard was funded by the Children's Bureau, Administration on Children, Youth and Families, Administration for Children and Families, U.S. Department of Health and Human Services, under grant #90CA1866. The contents of this dashboard are solely the responsibility of DCYF, and do not necessarily represent the official views of the Children's Bureau.
Questions? For questions about the maps or underlying data, email oiaa@dcyf.wa.gov.
